
Last summer, Cambridge PhD students Callum Pearman, Aisling Dunn and Philippa Slay joined an international scientific cruise to take the pulse of the Iceland mantle plume. Callum describes the science behind the expedition in the blog post below.
What Did We Set Out To Find Out?
The Iceland plume is a large column of especially hot mantle rock that rises from deep underneath Iceland. This plume is thought to be the hottest and largest example of a mantle upwelling anywhere on our planet, potentially rising from Earth’s outer core. When this plume reaches the near surface, it can have huge impacts on many critical Earth processes. For example: volcanism on Iceland, formation of the North Atlantic ocean crust, and global climate. In fact, periodic variation in the temperature of this plume has been suggested as the cause for the onset of glaciation in the Northern Hemisphere!
In this 6-week marine expedition to the North Atlantic Ocean, we set out to test several key hypotheses surrounding how this plume interacts with these dynamic processes. In particular, does the plume vary (or ’pulse’) in its temperature – and does this variation affect the formation and thickness of the ocean crust and wider climate?
Setting Sail

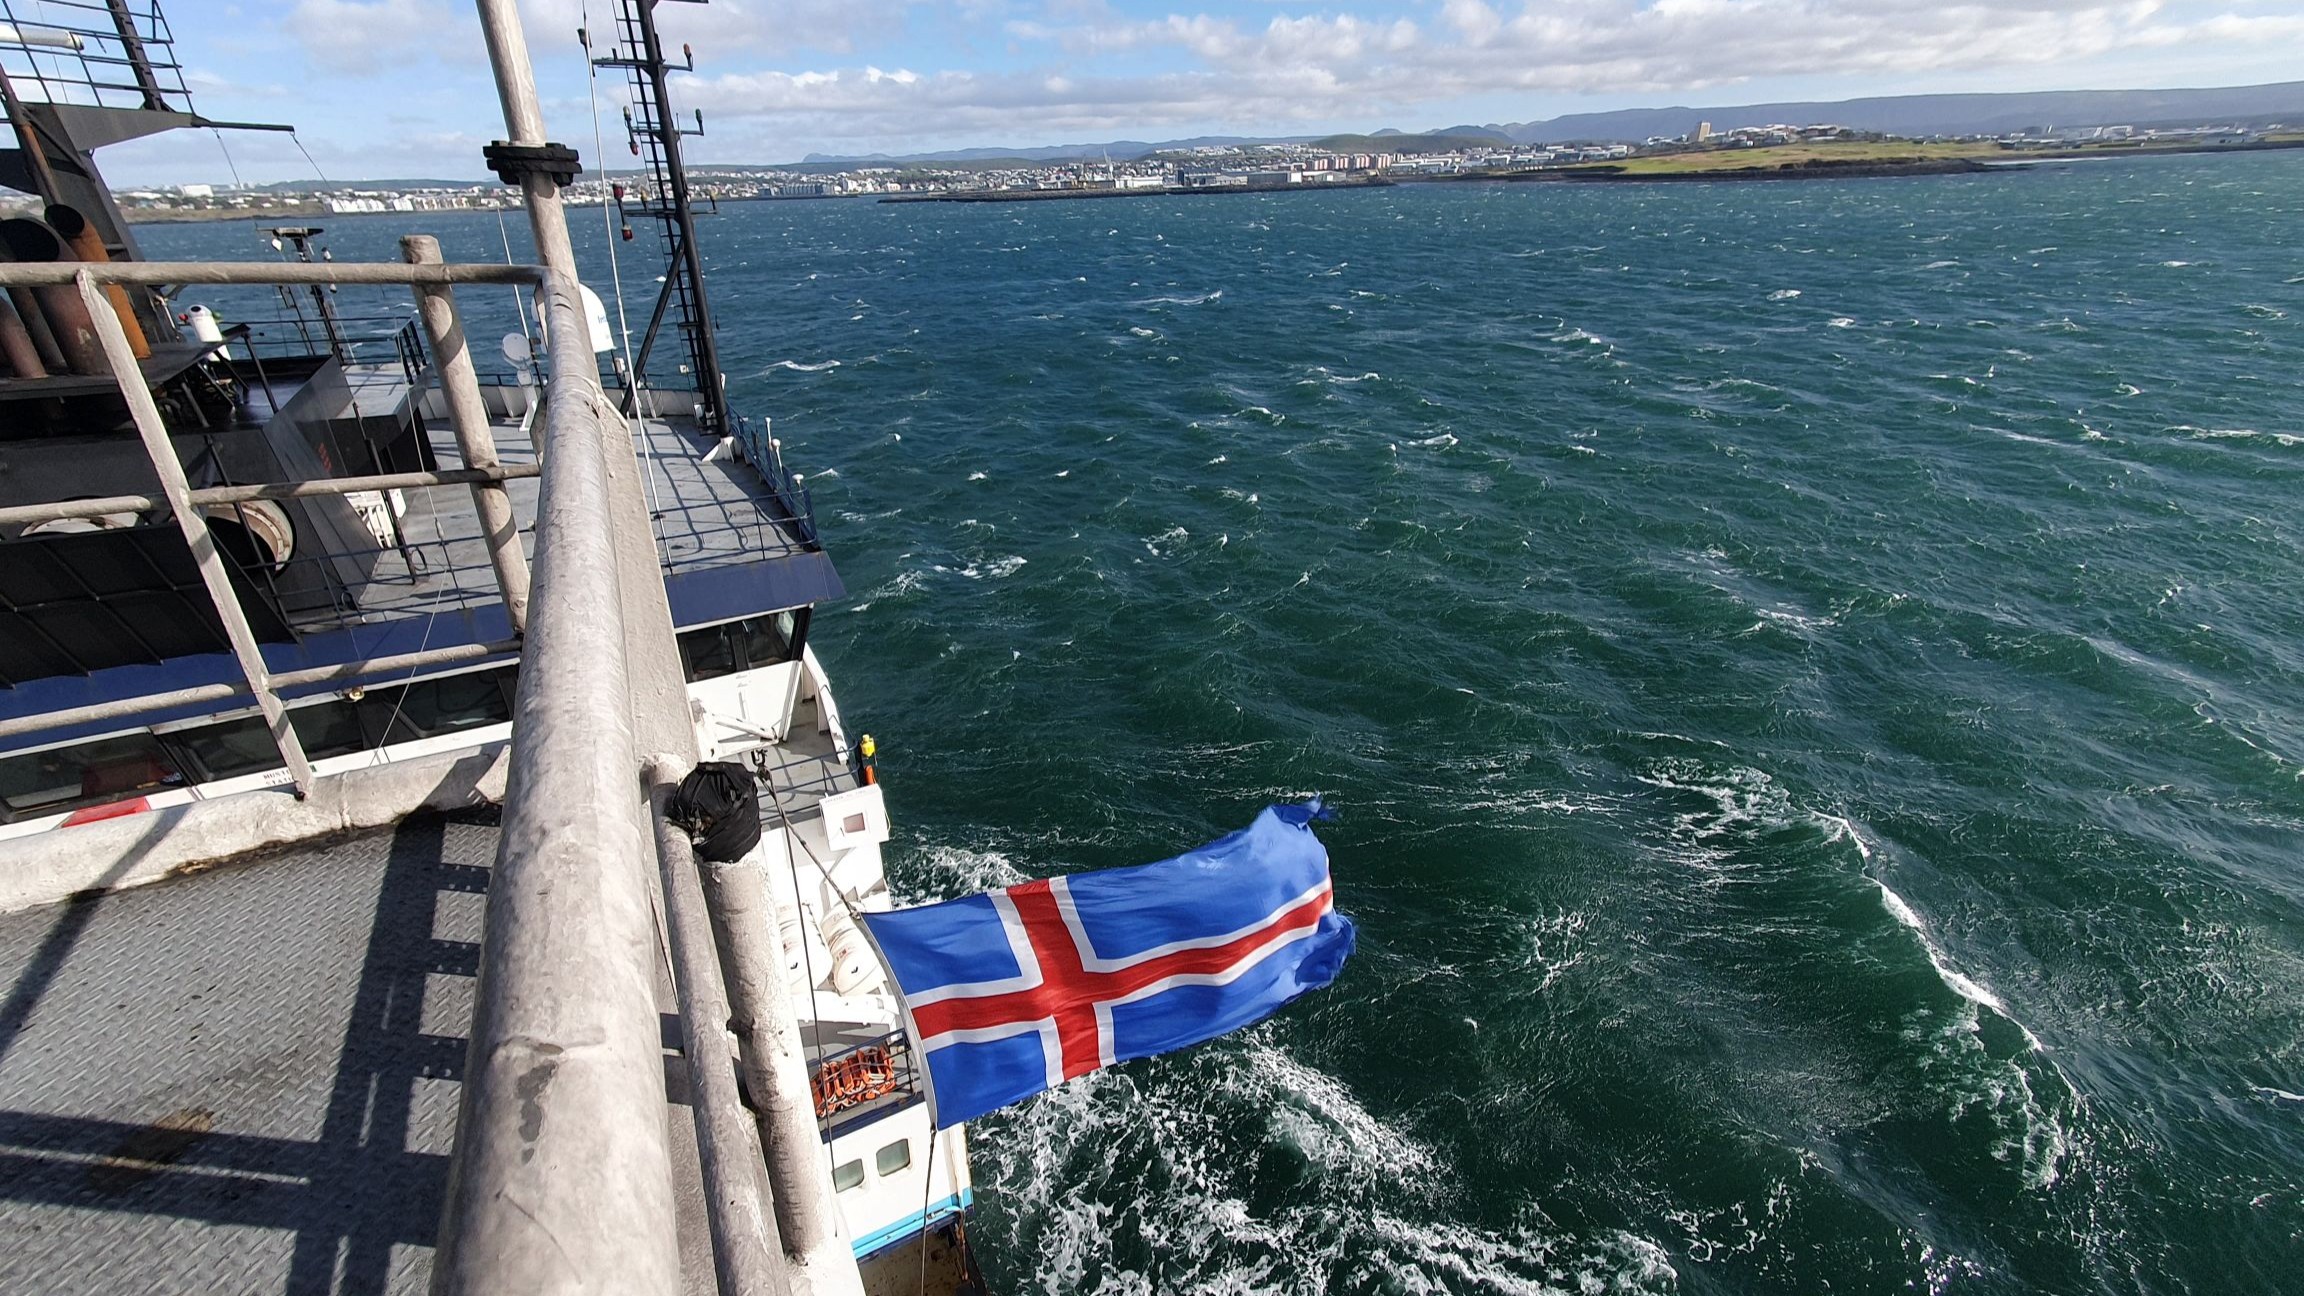
The R/V Marcus G Langseth, our home for 6 weeks from August-September 2024, is an ex-industry seismic vessel owned by the Lamont-Doherty Earth Observatory at Columbia University. The US National Science Foundation agreed with UK NERC to loan us this ship to conduct our wide-angle seismic refraction and reflection experiment.
The science team met up at the port just south of Reykjavík on the 2nd of August, ready to head out to sea! The team was assembled from a collaboration of Cambridge, Birmingham, Southampton, and Imperial Universities in the UK, and Scripps Institute in California. As a team of geophysicists, our aim was to use the ship’s seismic instruments to measure the thickness and structure of the ocean crust. Critically, these measurements would be made in the same locations as recent IODP drilling (sailed on by Nicky White).

We got to know each other quickly, as well as the huge range of personalities in the crew, who spend 6 months a year living and working at sea.
The biggest adjustment in the first few days was getting used to the constant rocking of the waves, and constant whirring of the diesel engines and thrusters! The ship was like a maze at first, but it wasn’t long before we were all navigating like old hands!
The Science Begins
One of the first major science jobs was the deployment of the OBSs – or ‘little yellow science guys’ as one of our social media followers named them. These instruments are built and carefully checked and double checked before they are sent to the sea floor.
We then detonate our airguns, sailing over the instruments, and hope they are recording a treasure-trove of data!

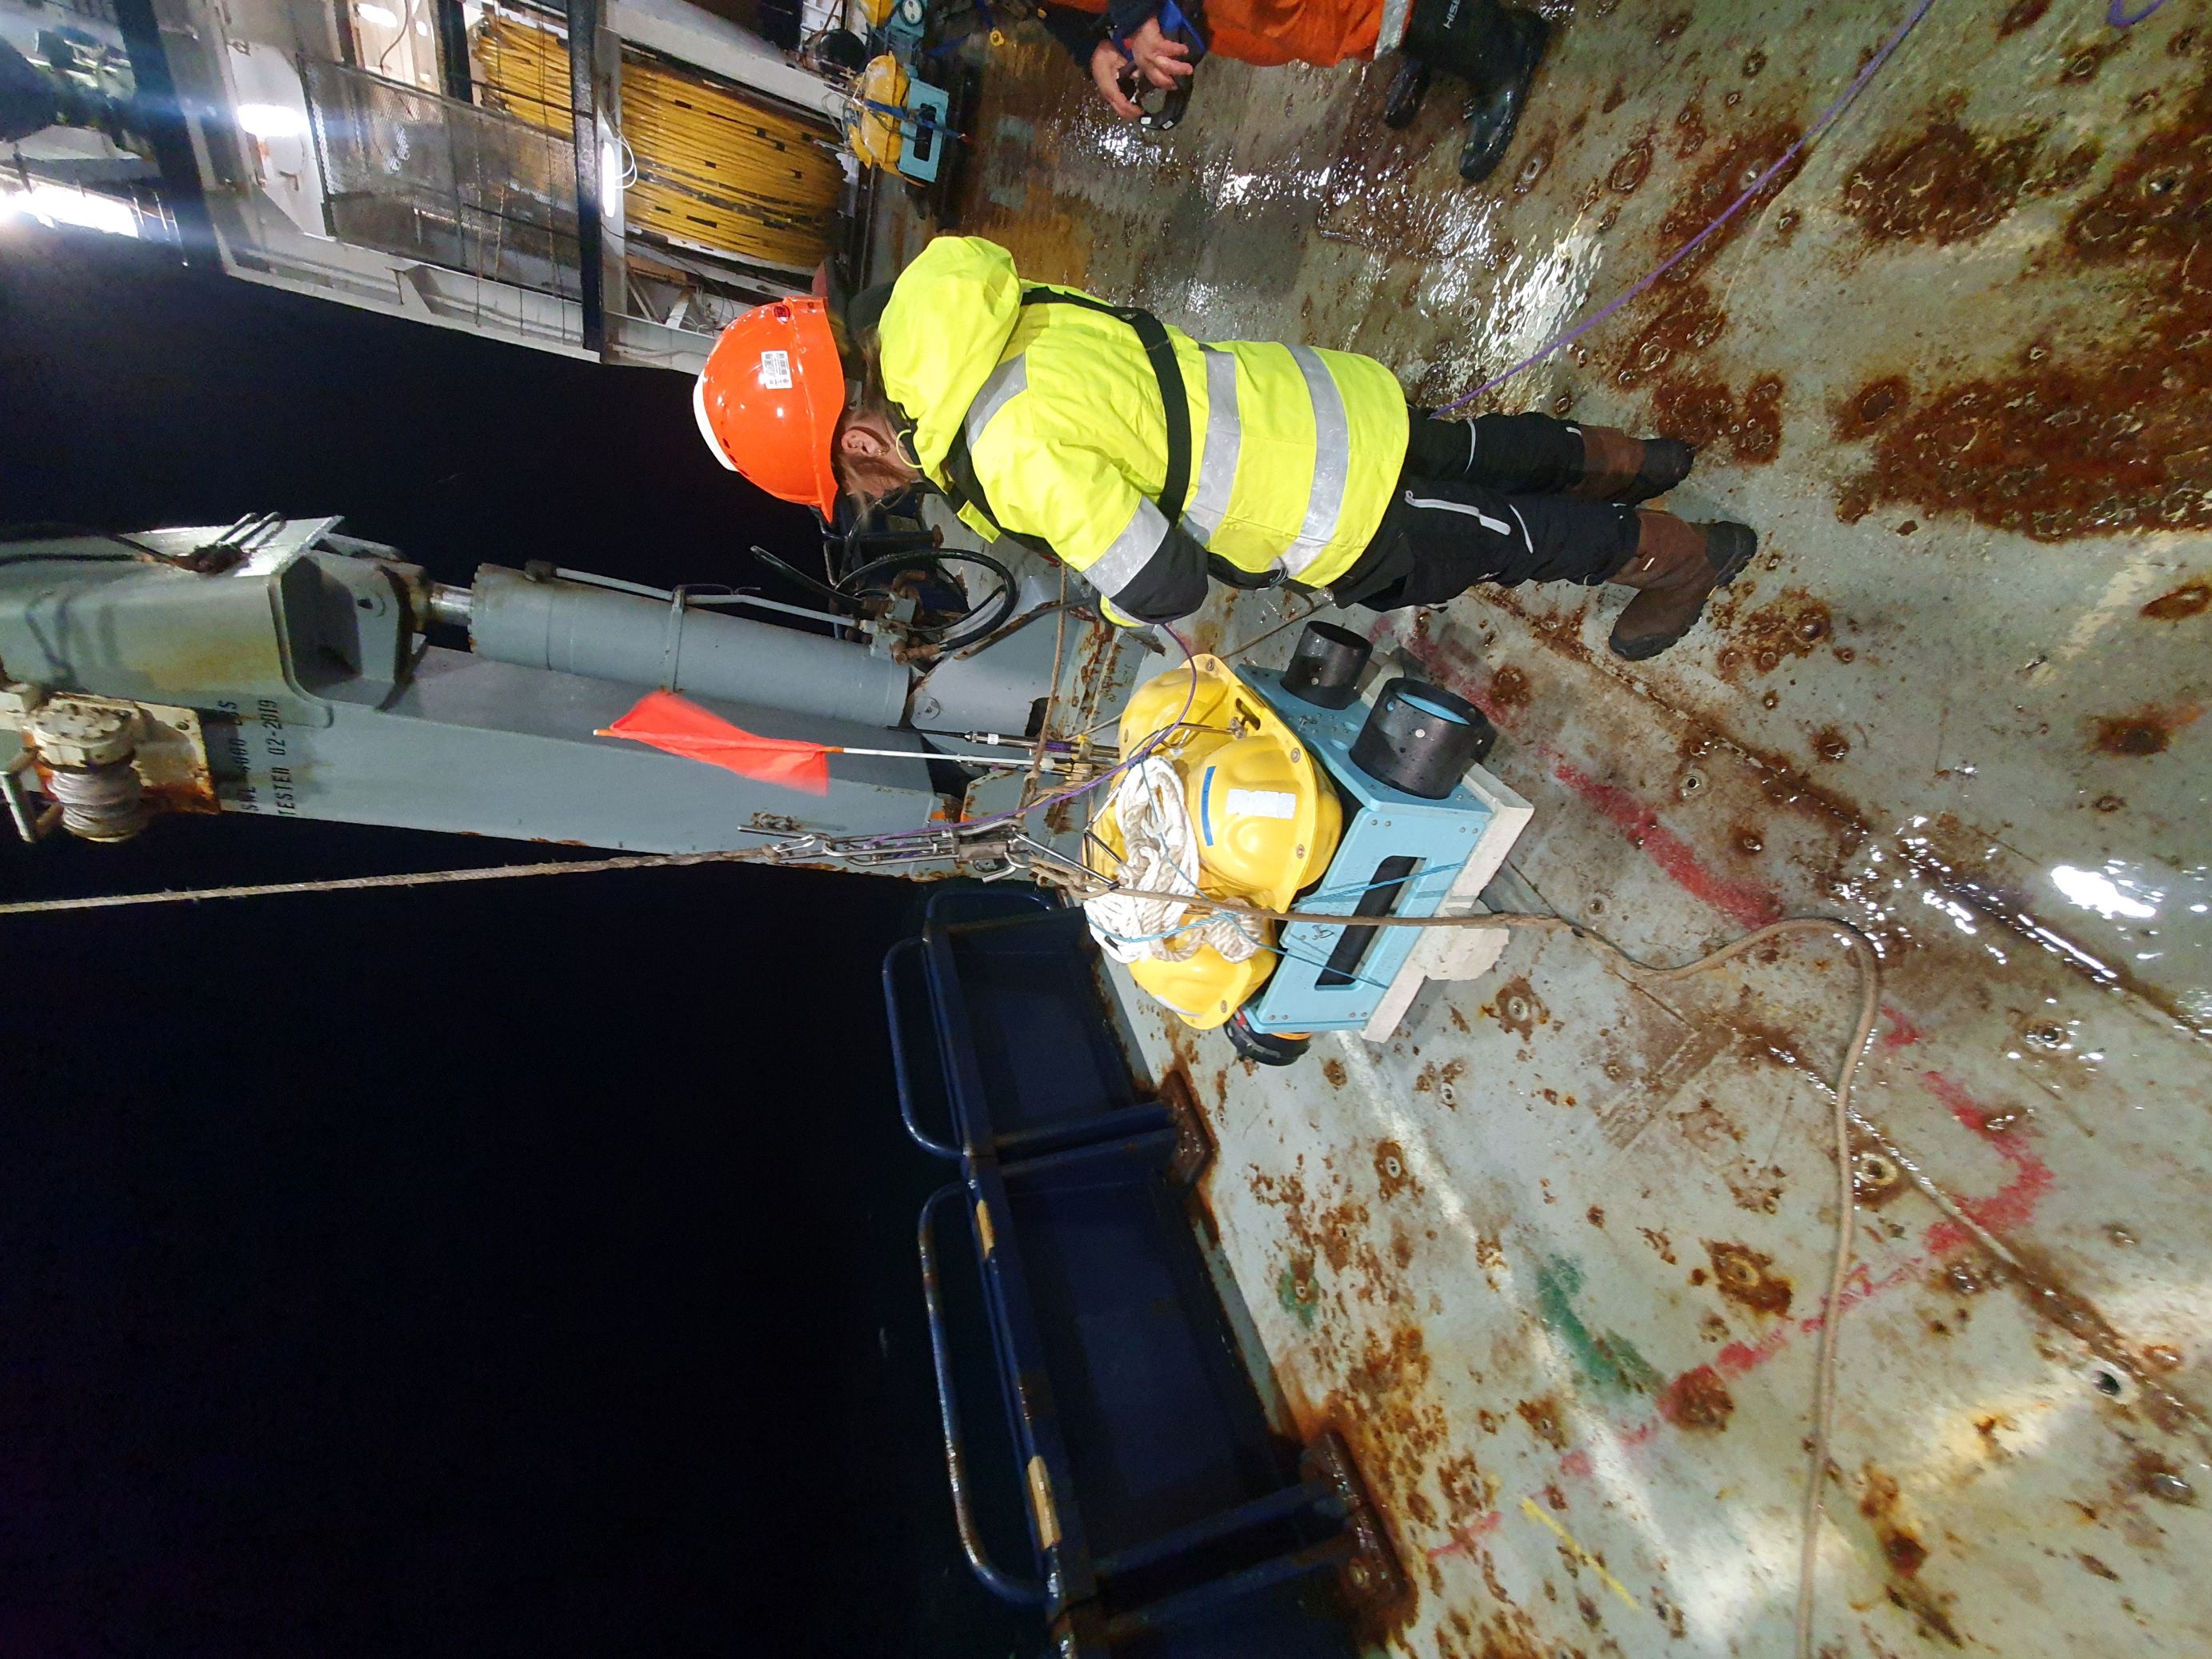
Ocean Bottom Seismometers being built and deployed into the ocean depths. These instruments sit on the seafloor and record how the energy travels through layers within the crust and potentially mantle. Flags and beacons help us find the instrument when it pops back up to the surface.
This part of the experiment went very well. We deployed, shot over, and recovered 149 of 150 OBS drops and recorded excellent data. Although the weather wasn’t always kind, and we worked through waves of up to 7m in height, the process of OBS deployment and recovery was hugely satisfying for the science team!


Pictures showing the variable weather we experienced! Large waves and storms are expected for the Central North Atlantic – particularly nearing September, and so we were ready to work in almost all conditions including crashing waves! But it wasn’t all bad, we had a few days of calm seas where even sea birds stopped to rest their wings. Left photo credit: Cassi Frey, Head PSO (protected species observer)
In addition to the recording of data with these OBS, an important part of the ship’s goals was to survey the sea floor. This involves the use of a multibeam echosounder, or array of transducers on the hull of the ship, to map out the topography (bathymetry) of the sea floor. We saw some amazing images when processing, including the Mid-Atlantic Ridge (tectonic plate boundary), and subsea volcanoes!


Left: processed image from the multibeam echosounder of the Mid-Atlantic Ridge. Red area shows the boundary between the Eurasian and North American tectonic plates. Right: 3D view of multibeam echosounder data over an axial seamount along the MAR
When we weren’t out on deck with the instruments, we were in the lab looking at the quality of the data. This involved working in the ‘seismic control lab’ – which has a huge number of screens for monitoring every system in the experiment!

Once the OBS work was done, we re-shot over the lines with the ‘streamer hydrophones’ deployed. This recorded seismic reflection data of the sedimentary layers above the crust.

After 6 weeks, all was done! We had completed all our main science objectives and collected very promising data. All that was left was to sail back to the port in Iceland and grab a well-deserved pint after 6 weeks on a dry vessel! This data is now being worked up into models of the crustal structure by NERC funded postdoctoral researchers.
Follow the IMPULSE expedition on Instagram.