
My last blog about the WACSWAIN project was in February 2020. We had just started the chemical analysis of our 651-metre-long ice core from Skytrain Ice Rise (Antarctica). The theme of this article is time – the first aspect being that a lot of time has since passed. Soon after I wrote last, our labwork was completely shut down by the pandemic, some of the team went back to their families in other countries, and we all learnt what Zoom meetings were.
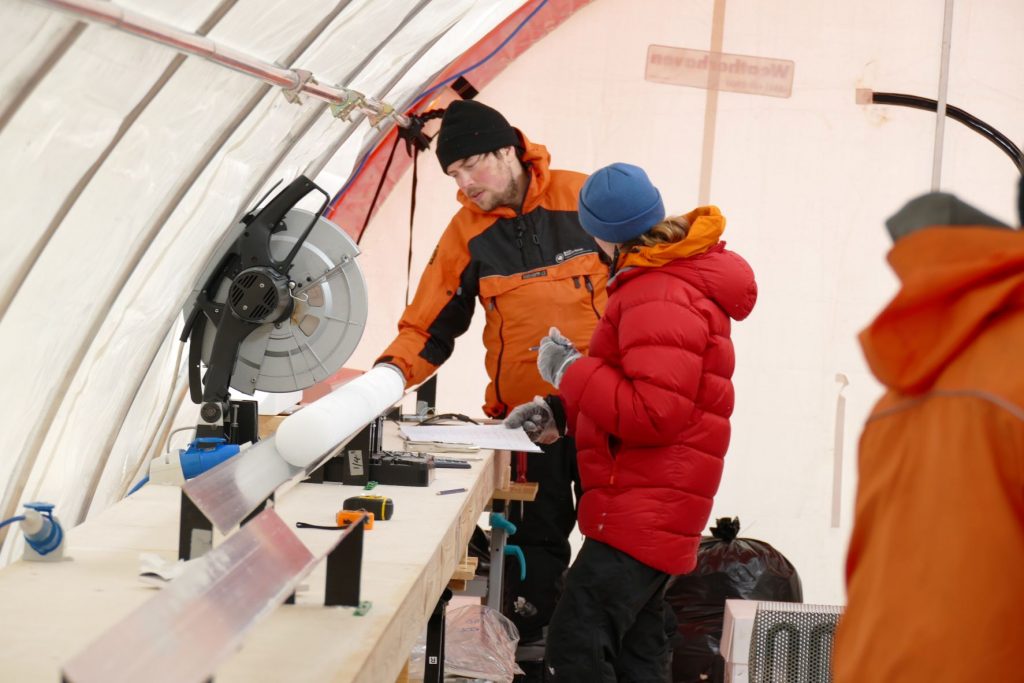
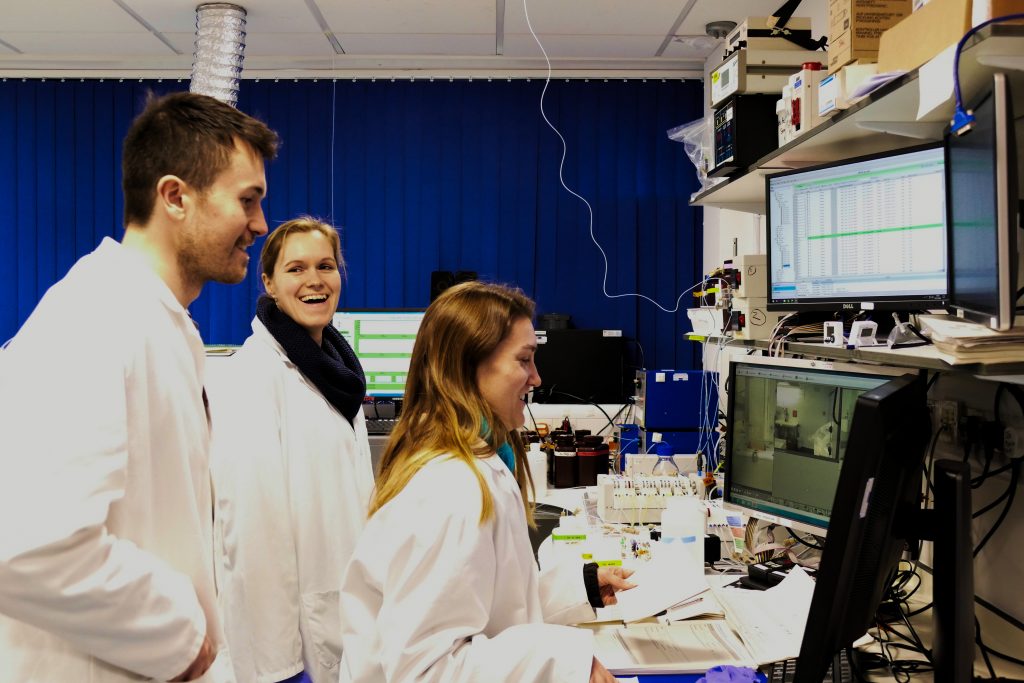
The team got back into the cold room in June 2020. The task was to place each 80 cm strip of ice on the melt device in the cold room and analyse every section on as many instruments as possible. This is very demanding work – each instrument has its own temperamental ways, and you are working against the clock, as the ice is melting at 3 cm per minute. But with a fantastic effort from everyone involved, both from the Department of Earth Sciences and the British Antarctic Survey, the whole core was analysed by the end of the autumn. We now have almost continuous data for water isotopes, dust, many chemical components, and methane.
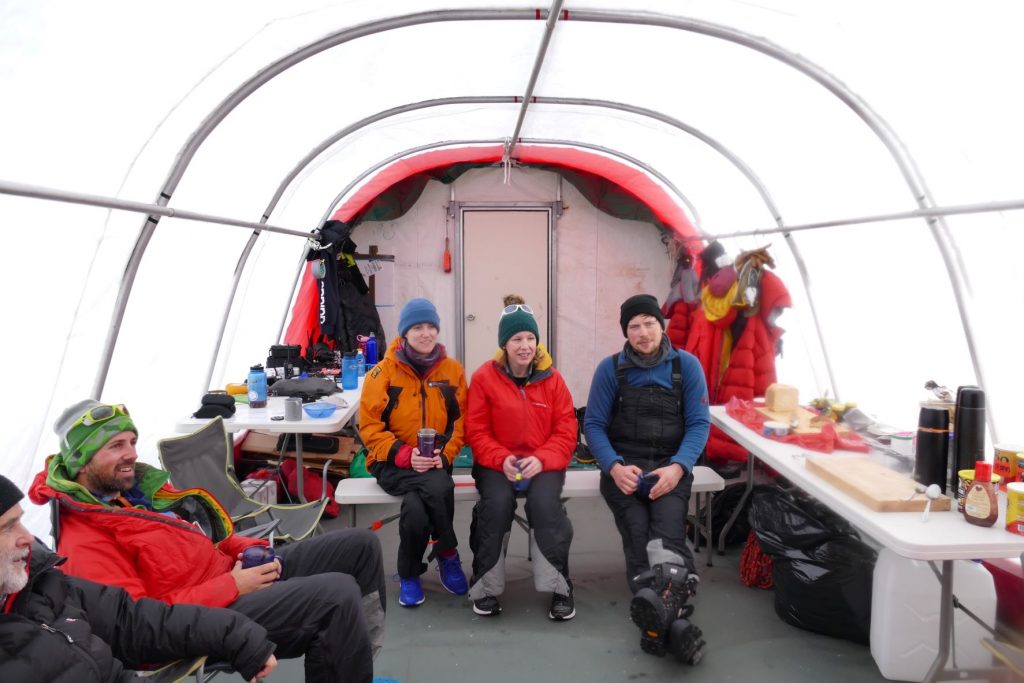
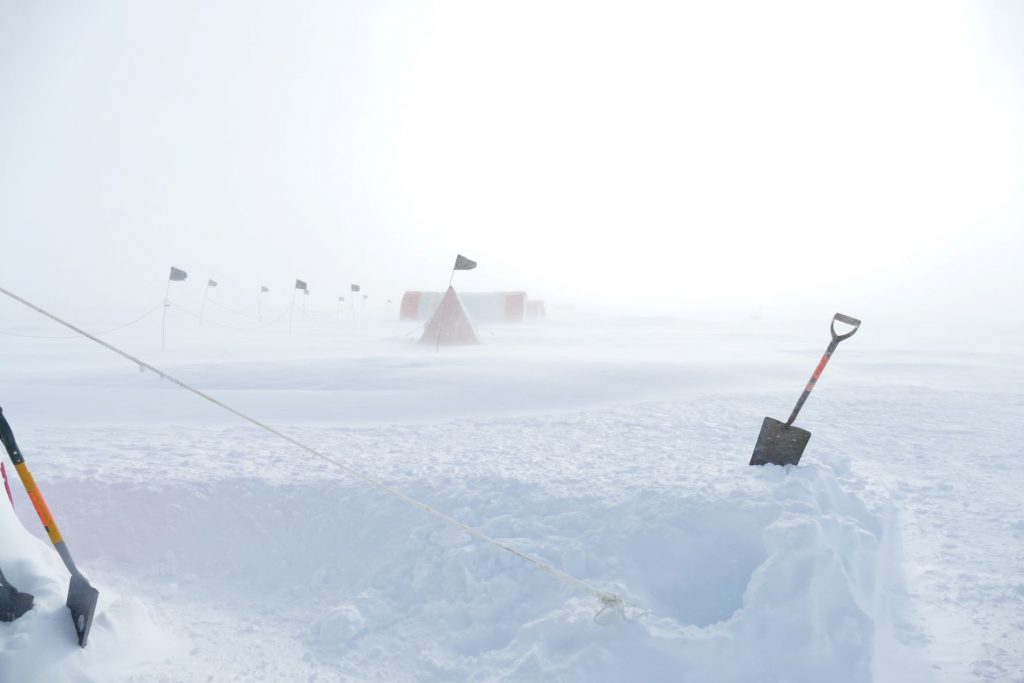
The team at Skytrain Ice Rise, Antarctica.
Over the last year we have been processing and validating the data – making sure we have a clean dataset on a good depth scale, and making discrete analyses to check the continuous data and add to it. We have been trying to understand what it means (certainly the topic of a future blog) and putting an age scale on it is an important part of that.
So this is the second allusion to time as the theme of this article. The lab work produced a fantastic set of graphs of components against depth. Now we had to spend an equal amount of effort plotting them against time. We expect to submit two papers about the age scale of the Skytrain Ice Rise ice core very soon, and only when we have done that can we publish credible hypotheses about what happened to climate and the West Antarctic Ice Sheet.
In many cores, dating the ice is an easy job to start with, because many of the measured components show an annual cycle. By counting the peaks and troughs in concentration one can construct an age scale. This is partly possible at Skytrain Ice Rise, but the low snow accumulation rate (equivalent to 13 cm of ice per year) makes it a challenge, because the resolution of many of the instruments is insufficient to allow reliable identification of each year. We commissioned (from colleagues in Germany) analyses of tritium, which shows a well-known pattern corresponding to the occurrence of nuclear bomb tests starting in the 1950s, to confirm our counting near the top. We are using sulfur isotope measurements to confirm the presence of volcanoes of known age. And we are using the pattern of methane concentration, matched against variations seen in previous cores, to confirm the age of the gas components in the core. Together these are allowing a rather precise dating of the upper two thousand years of the ice.
Below that we are dating the ice using a combination of ice flow modelling with a series of fixed dates determined by matching features in our ice core against those seen in other cores that have already been dated. Methane is particularly useful in this regard. During the last glacial period from about one hundred and ten to ten thousand years ago, it shows an easily recognised pattern of abrupt increases and more gradual decreases. These are related to abrupt temperature swings that centred on Greenland and the North Atlantic, known as Dansgaard-Oeschger events. We were able to identify most of these events and place a fixed age on each rapid methane increase.
Additional ties came from other measurements. For example we arranged for colleagues in Sweden and Switzerland to analyse isotope beryllium-10 (produced by cosmic rays) across a section of ice just over forty thousand years old. That is the age of the Laschamp Event, a period of weakening of Earth’s magnetic field, during which cosmic rays could more easily enter Earth’s atmosphere. The data from Skytrain clearly show the same temporal pattern as has been observed in other cores, allowing us to pin the age very precisely there.
The biggest challenge has been to robustly date the section from the Last Interglacial, around 125,000 years ago – our most prominent target for the project. This occurs in the lowest 30 metres of ice, which is highly thinned and, towards the base, folded – making data collection harder. Nonetheless, using a combination methane concentrations and the isotopic composition of oxygen in the air bubbles, we have been able to confidently place dates on ice through most of the interglacial.
After all this effort we can now state with certainty that we have a good record extending back to about 125,000 years (through the last glacial period and most of the last interglacial). This will allow us to meet the main goals of the WACSWAIN project.
It has been a long two years for everyone. Some of our postdoctoral scientists have moved on to their next positions, but are still working with us. The rest of us are anticipating an exciting year in which we use our data and our new timescale to tell the world what happened to the ice sheet when it was warm in the last interglacial. But that is for another….time.